Index Funds vs Picking Stocks: What the Long-Run Evidence Shows
You put $10,000 into three stocks last spring. The one you were least sure about — a $2,000 position — doubled. The $3,000 position went nowhere. And the $5,000 position, the one you’d read the most about and felt best about, is down 30%. Net, you’re sitting on $10,500. Your neighbor put the same $10,000 into a broad index fund, never opened the app again, and is up 11% to $11,100. You did the work. They did nothing. They’re ahead.
So the question isn’t really “can stock picking work.” It’s whether the version of stock picking available to you, at the costs you actually pay, tends to end up ahead of the version that requires one click a month.
The short answer
Over long stretches, most stock pickers — professional ones included — do not beat a broad market index after costs. A minority do. Picking that minority in advance, before you know which ones they were, is the part nobody has solved reliably.

The strongest evidence on this comes from mutual funds, because funds publish returns and fees in a way individual brokerage accounts don’t. Eugene Fama and Kenneth French took the full cross-section of US mutual funds and asked a sharper question than “how many beat the market.” Their question was: if none of these managers had any skill at all, and returns were pure noise, how many would still finish ahead by luck? Their answer was that the distribution of actual fund performance, after costs, looks close to what chance alone would produce (Fama and French, “Luck versus Skill in the Cross-Section of Mutual Fund Returns,” Journal of Finance). Some funds did beat the market. Not enough of them, and not persistently enough, to distinguish skill from a long run of coin flips.
That’s the finding people usually paraphrase as “index funds win.” It’s more specific than that, and more useful. It doesn’t say markets can’t be beaten. It says the ones who beat it look, statistically, a lot like the winners of a very large lottery — and that a lottery winner’s next ticket is no better than yours.
Where the money actually goes
Costs do more of the work here than most people expect, and they do it invisibly.
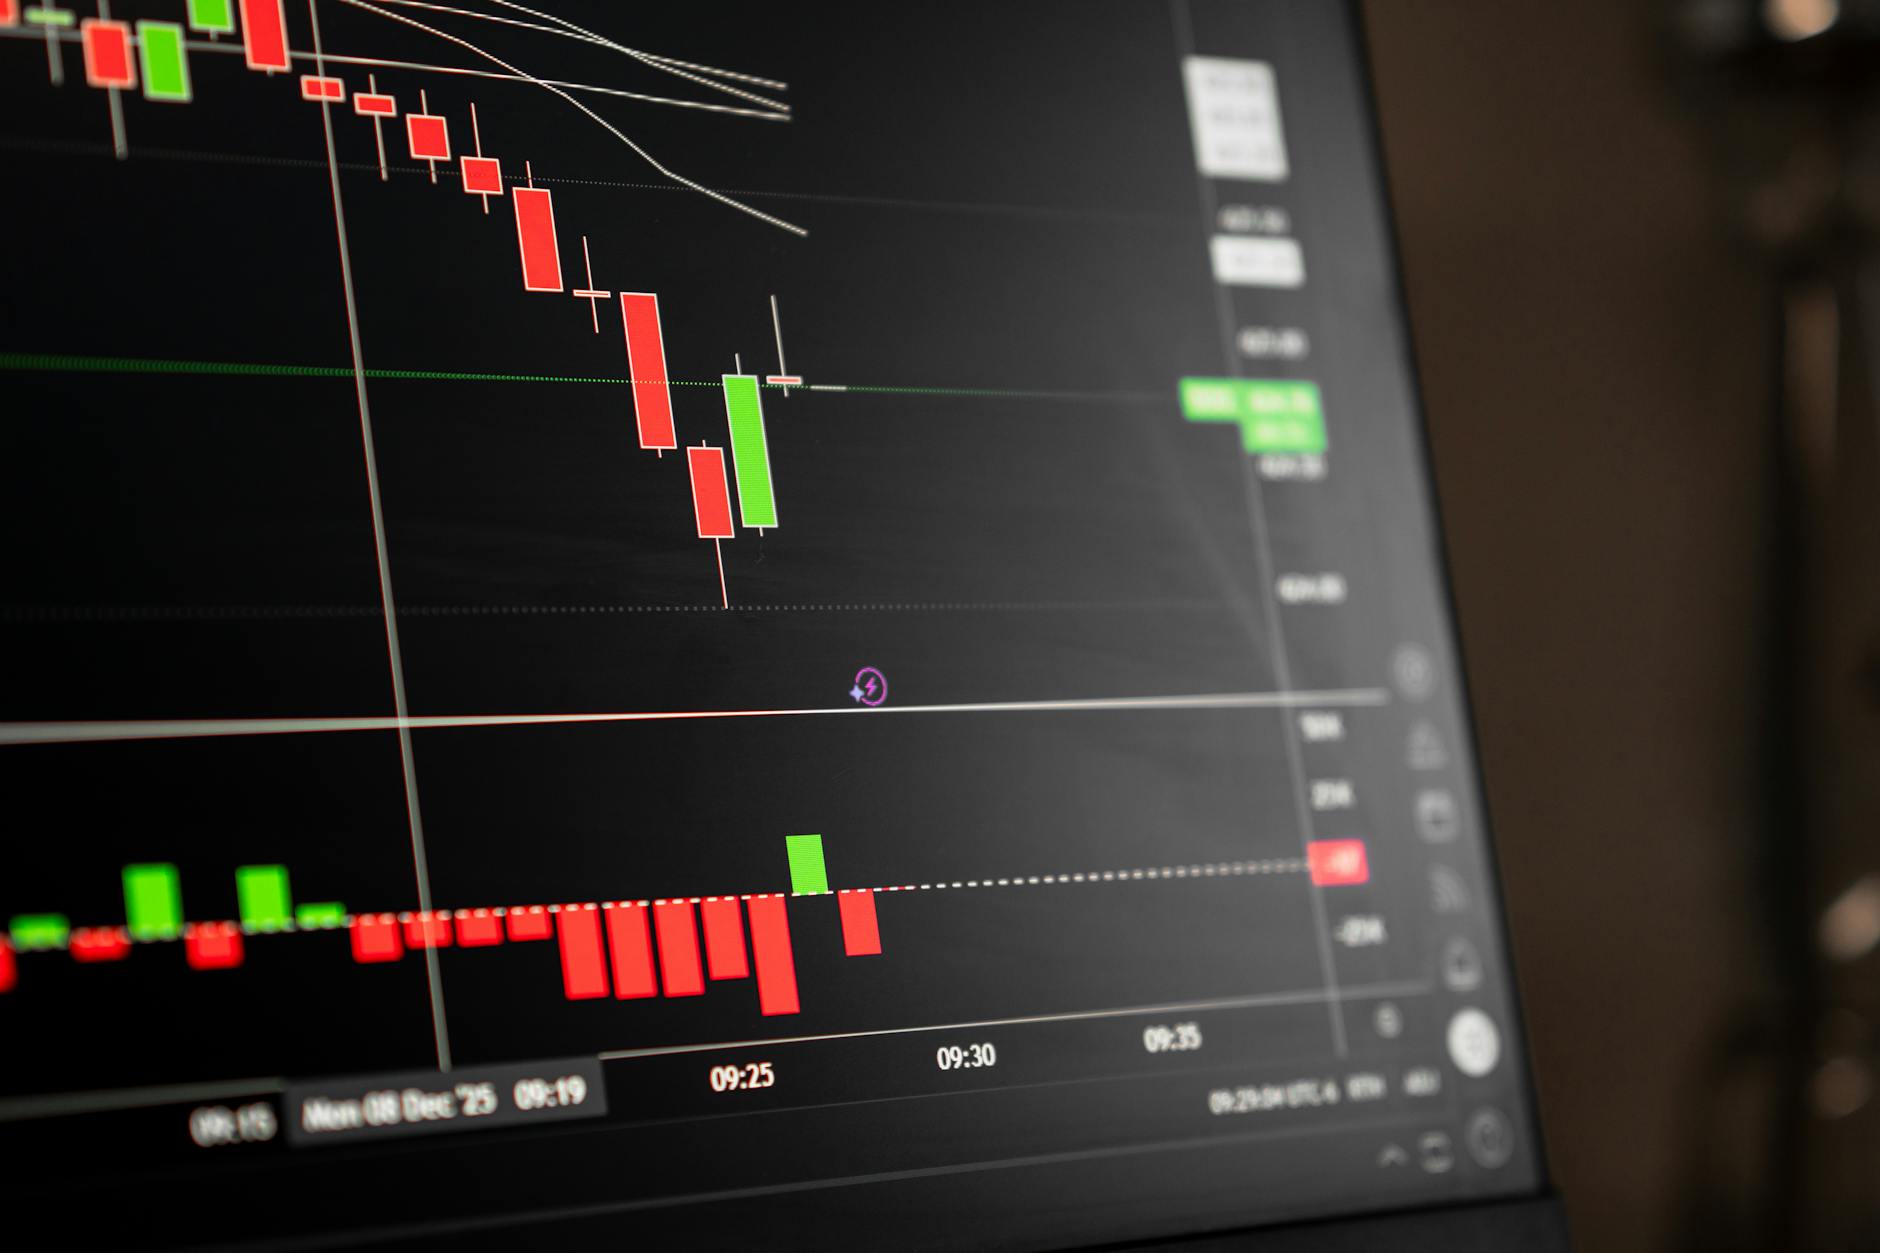
Go back to your three positions. Say the $5,000 loser was 100 shares you bought at $50. The screen showed $50, but the market showed you two prices: $49.98 to sell, $50.02 to buy. You paid the higher one. Four cents a share, $4 on that trade, paid again when you exit. On a single round trip that’s rounding error. On a habit — trimming, adding, rotating out of the name that’s annoying you — it’s a tax you pay every time you change your mind, and changing your mind is the whole activity.
Then there’s the fund layer. A broad index fund can run on a few hundredths of a percent a year. An actively managed fund charges more, often by a factor of ten or twenty, because it’s paying analysts, traders, and the infrastructure to try. Add the cash a turnover-heavy strategy holds between trades, which earns nothing while the market moves.
None of this arrives as a bad day you’d remember. There’s no line item, no alert. It comes out of the compounding base every year, silently, which is exactly why it’s easy to underweight when you’re comparing your winners to your neighbor’s boring fund.
Twenty years of the same 1.25 points
Here’s the arithmetic, using the same $10,000 you started with.

Both portfolios earn 7% gross annually before any costs. That number is chosen because it’s round, not because it’s a forecast — nobody knows what the next twenty years return. The index side carries 0.05% in annual cost. The active or self-picked side carries 1.30%, covering fund fees, spreads, and cash drag. Gross returns identical. The only thing that differs is the cost line.
Net of costs, that’s 6.95% a year against 5.70% a year. After twenty years, the index side is worth about $38,330. The other side is worth about $30,300. The gap is roughly $8,030 — eighty percent of the original stake, gone to a difference of 1.25 percentage points a year.
Look at where the damage sits in time. In year one, the cost difference is $125. Trivially small; you’d never notice it. By year twenty, the annual gap is running over $400, because the fee is charged on a balance that the fee itself has been shrinking for nineteen years. That’s the mechanism. You don’t lose the fee. You lose the fee and everything the fee would have earned.
Change the assumptions and the number moves, sometimes a lot. Cut the cost gap to half a point and most of the damage disappears. Shorten the horizon to five years and it’s a few hundred dollars. Run it with your own fees, on your own balance, over your own horizon, before you conclude anything about your account.
Why your neighbor barely felt the bad one
Your losing position dropped 30%. Because it was $5,000 of a $10,000 portfolio, that 30% became a 15% hit to everything you own. Half your money, taking a real fall.
Your neighbor owned that same company. In a fund holding hundreds of names weighted by size, it might have been two-tenths of a percent of the portfolio. Same 30% fall, same company, same news. Drag on their total: about six hundredths of one percent. They will never find out it happened.
That’s the entire trade you’re making when you concentrate. Not “diversification is safer” as a slogan — the specific arithmetic that a position’s weight multiplies its damage. Five equal-weight names means any one of them going to zero costs you 20% of everything. Terrible years happen to good companies, for reasons that had nothing to do with the quality of your research, and concentration converts those events from footnotes into your year.
The flip side is real and worth stating plainly: concentration is also why your $2,000 doubler moved the needle at all. In your neighbor’s fund it did nothing visible. Diversification doesn’t just cut your losses; it cuts your wins by the same mechanism. You are choosing a narrower band of outcomes, not a higher expected return.
Investor.gov’s overview of diversification walks through this tradeoff from the regulator’s side, and FINRA’s investing basics resources cover the fee-comparison half of it. Neither one tells you to buy an index fund. They explain what you’re accepting when you don’t.
What this does not tell you
The averages hide a lot, and being straight about the gaps matters more than the headline finding.
It doesn’t say no individual can beat the market. Some do, over long periods, and a few of them almost certainly aren’t lucky. The claim is narrower: identifying them ahead of time, from public information, has been extremely difficult, and most people who try — including people who do it full-time with research budgets — don’t clear the bar after costs.
It ignores taxes entirely. Your $2,000 doubler, sold inside a year, produces a short-term capital gain taxed as ordinary income. Held past a year and sold, it’s a long-term gain at a lower rate. Your neighbor’s index fund, untouched, produces no realized gain at all until they sell. In a taxable account that difference can be larger than the fee gap the table above is built on, and none of it appears in those numbers.
It assumes you stayed invested. A fund’s published twenty-year return belongs to someone who held for twenty years. If you bought after a strong run and sold three months into a decline, your dollar return isn’t the fund’s return — it’s whatever your specific entry and exit produced. This applies to index investors too. A cheap fund you panic-sell in a drawdown has cost you far more than its expense ratio ever would.
It says nothing about whether the mix suits you. Risk tolerance, time horizon, what the money is for, whether you’ll need it in three years or thirty — none of that is in a cost comparison. Someone five years from retirement and someone with forty years of contributions ahead are answering different questions, and this article is answering neither.
One twenty-year illustration with fixed inputs is not a forecast. Real returns arrive lumpy. The order they arrive in matters, especially if you’re adding or withdrawing money along the way. A smooth 7% line is a teaching tool, not a description of any decade that has ever happened.
FAQ
Does this mean stock picking never works?
No. Individual investors and professional managers do outperform, sometimes for long stretches. The evidence says that outcome is uncommon, hard to distinguish from luck after the fact, and much harder to identify before the fact. Those are different claims from “it’s impossible.”
If costs matter this much, why do active funds still charge more?
They’re paying for something real: analysts, trading desks, data, and the operational cost of running a strategy that turns over. The open question isn’t whether that work happens. It’s whether it produces enough extra return to cover its own price tag, which is exactly what the fund performance research keeps testing.
Are all index funds basically the same?
No. Two funds both labeled “index fund” can track different benchmarks, hold very different numbers of companies, weight them differently, and charge fees that differ by an order of magnitude. The word “index” in the name tells you the strategy is rules-based. It tells you nothing about what rules or what price.
Does a low expense ratio guarantee good performance?
No. A low fee reduces the drag on whatever the underlying index does. It has no influence on what the index does. A very cheap fund tracking a market that falls 20% will fall roughly 20%, and the low fee will have saved you a rounding error on the way down.
Can I hold an index fund and pick a few stocks too?
Many people structure accounts this way, with a core holding and a smaller amount set aside for individual names. Whether that split fits depends on your timeline, what the money is for, and how you’d behave if the picked portion had a bad year. That’s a decision for you, and if you want a professional read on it, a licensed advisor.
How do I find out what I’m actually paying?
For a fund, the expense ratio and the turnover rate are both in the prospectus, and both are worth writing down side by side — high turnover implies trading costs the expense ratio doesn’t capture. For your own trading, pull last year’s brokerage statements and add up commissions and fees. The spread cost won’t be itemized anywhere, so estimate it from your typical trade size and how often you traded.
What to check next
Two numbers are worth pulling before you decide anything. First, the all-in annual cost of every fund you hold, taken from the prospectus rather than memory. Second, what you personally paid last year in commissions, fees, and round trips, added up from statements instead of estimated from feel — that second number is usually the surprising one.
Then run the twenty-year arithmetic on your own balance, with your own cost gap. Not the 1.25 points used above. Yours. It either turns out to be small enough to ignore, in which case you’ve stopped worrying about it for a good reason, or it’s large enough that you now know precisely what the screen time is costing you.
This article is general information, not financial advice. See our disclaimer.
Sources
Related articles
- What a 1% Advisory Fee Costs vs 0.05% Over 20 Years A worked example shows how a 1% advisory fee versus a 0.05% index fund fee can cost tens of thousands of dollars over 20 years of compounding.
- How a 0.75% Expense Ratio Quietly Eats a Third of Your Returns A worked example showing how a small annual fee compounds over decades into a large share of your final balance.
- How Your Fund's Turnover Ratio Quietly Creates a Tax Bill A worked example showing how a mutual fund's portfolio turnover generates capital gains distributions and a tax bill you never asked for.