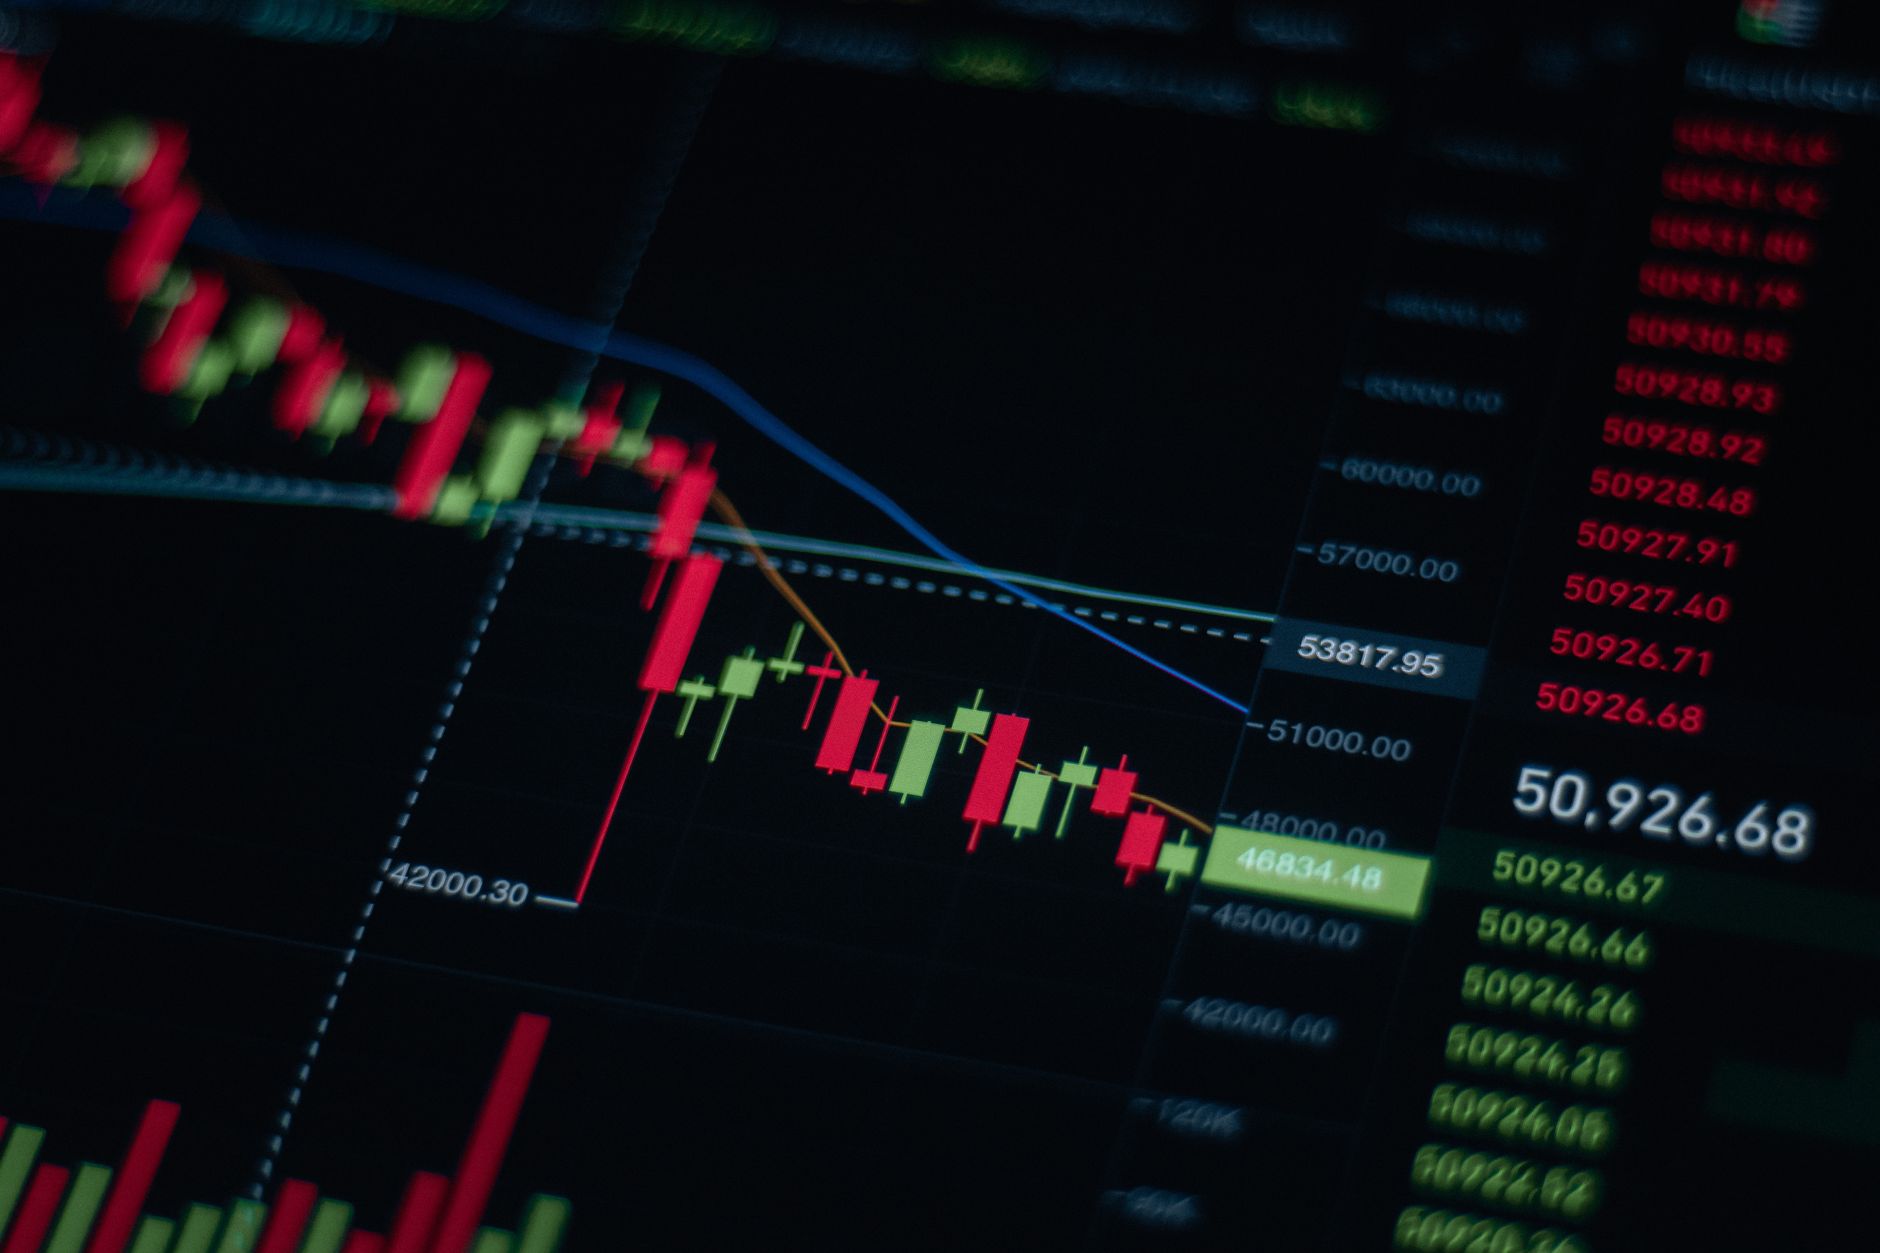
You place a market order for 500 shares. The screen showed $42.10. Your confirmation shows $42.31. Nobody stole from you. The market just moved between the moment you clicked and the moment your order filled. That gap is slippage, and over time it can quietly drain returns in a way that never shows up on a brokerage fee schedule.
This article explains what causes slippage, how to estimate what it actually costs, and which situations make it worse.
What Slippage Is
Slippage is the difference between the price you expected when you placed an order and the price at which the order actually executed.
It is not a fee. It does not appear as a line item. It is simply the consequence of two things being true at once: prices move continuously, and filling an order takes a nonzero amount of time and supply.
There are two common flavors:
Timing slippage happens because there is a gap between when you submit an order and when it reaches the exchange and finds a counterparty. In fast markets, prices can shift in that window even if your order is small.
Market impact slippage happens because your order itself consumes available supply. If you want to buy 10,000 shares and only 2,000 are offered at the best ask, the remaining 8,000 have to be filled at progressively higher prices.
Both can happen on the same trade.
The Bid-Ask Spread Is the Floor
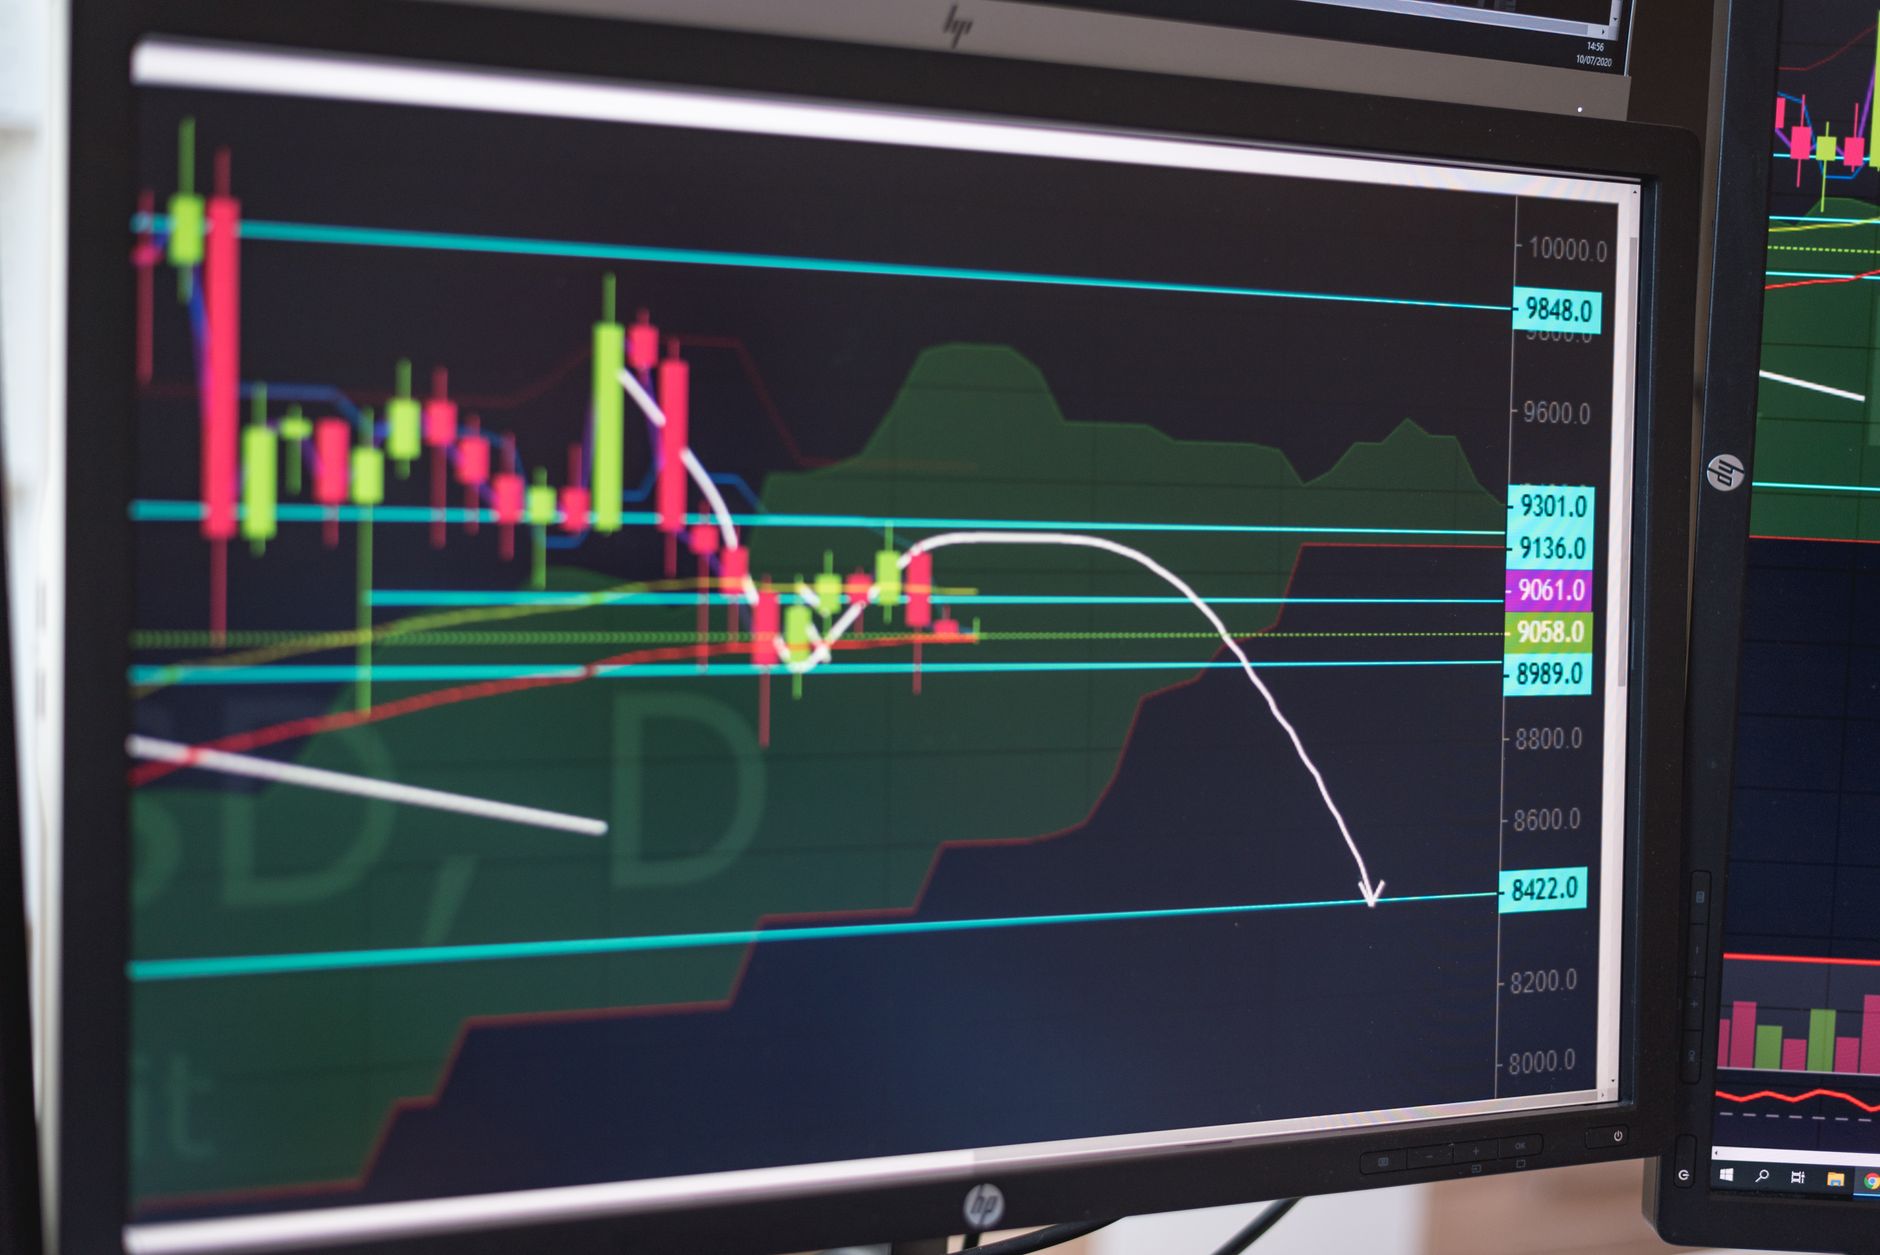
Before slippage even enters the picture, there is the spread. The bid is the highest price a buyer will pay right now; the ask is the lowest price a seller will accept. When you buy at market, you pay the ask. When you sell at market, you receive the bid.
If the bid is $42.00 and the ask is $42.05, the spread is $0.05, or about 0.12%. That is not slippage in the strict sense, but it is a cost of transacting that retail traders often underestimate, especially when they trade frequently.
Slippage sits on top of this. You pay the spread, and then if conditions are poor, you also pay slippage.
When Slippage Bites Hardest
Thin order books
Every exchange keeps a record of resting limit orders at various price levels, called the order book. A thick book has many orders sitting near the top of each side; a thin book does not. When you send a market order into a thin book, it eats through each price level quickly and you end up with a fill well away from where you started.
This matters most for:
- Securities with low average daily volume
- Assets traded outside their primary market hours (pre-market, after-hours)
- Cryptocurrency pairs outside the largest tokens
- Options with wide strikes or distant expirations
Fast-moving markets
News releases, earnings announcements, central bank decisions, and geopolitical shocks all cause prices to move faster than normal. Market makers, who typically post the resting orders that give you a place to fill, pull their quotes during these moments because they do not want to be on the wrong side of a sudden gap. The result is a thinner book at exactly the moment when retail traders are most tempted to act quickly.
Large orders relative to volume
The standard way to measure this is the ratio of your order size to the average daily volume in that instrument. If you are trying to buy a quantity that equals a meaningful fraction of what trades in a full day, you will move the market against yourself. Institutional traders have entire teams and algorithms dedicated to breaking large orders into small pieces to manage this. Retail traders generally do not face this problem on liquid large-cap stocks, but it can appear quickly in small-cap equities, thin ETFs, or illiquid options.
Market orders during volatile periods
A limit order caps the price you pay or receive. A market order does not. It says: fill me now, whatever the price. In calm conditions, that is often fine. In volatile conditions, "whatever the price" can be a costly instruction.
A Worked Example
The following is an illustration using invented but realistic numbers. Assumptions are stated throughout.
Setup:
- You want to buy 1,000 shares of a mid-cap stock.
- The displayed best ask at the moment you click is $50.00.
- The spread at that moment is $0.06 (bid $49.94, ask $50.00).
- The order book shows: 400 shares at $50.00, 300 shares at $50.04, 300 shares at $50.11.
- You place a market order for all 1,000 shares.
Fill breakdown:
| Price Level | Shares Available | Your Fill |
|---|---|---|
| $50.00 | 400 | 400 shares |
| $50.04 | 300 | 300 shares |
| $50.11 | 300 | 300 shares |
Cost calculation:
| Portion | Shares | Price | Subtotal |
|---|---|---|---|
| First fill | 400 | $50.00 | $20,000.00 |
| Second fill | 300 | $50.04 | $15,012.00 |
| Third fill | 300 | $50.11 | $15,033.00 |
| Total | 1,000 | $50,045.00 |
Your average fill price: $50.045.
Your expected price: $50.00.
Slippage: $0.045 per share, or $45.00 on the full order.
As a percentage of expected cost: 0.09%.
That sounds small. But if you make 200 similar round-trip trades in a year, and slippage on each side averages $45, the annual drag is $18,000 on positions of $50,000 each, a 1.8% headwind before any other costs. Frequency amplifies what looks like rounding error on any single trade.
What This Does Not Tell You
This analysis assumes a static order book. In reality, the book is dynamic. Between the moment you see a price and the moment your order fills, other orders arrive, existing orders cancel, and market makers reprice. The slippage you actually receive may be better or worse than a snapshot of the book would predict.
It does not capture hidden orders. Many venues use dark pools or reserve orders that do not show on the visible book. Your fill might actually be better than expected because a large buyer was sitting quietly at $50.00. Or worse, if they have already consumed that liquidity.
It does not separate venue effects. Order routing decisions, payment for order flow arrangements, and the choice of exchange can all affect fill quality in ways that are hard to observe from the outside. Regulators require brokers to report execution quality statistics, but reading those reports requires understanding their methodology.
Percentage slippage looks different at different price points. The same $0.045 per share slippage costs more in percentage terms on a $5 stock than on a $500 stock. Comparing slippage across instruments requires normalizing to a common base.
This does not account for limit order opportunity cost. You can avoid market impact slippage by using limit orders, but then your order may not fill at all, or may fill only partially. Missing a trade has its own cost that is harder to quantify.

FAQ
Does slippage always hurt the buyer more than the seller?
No. Slippage is symmetric in principle. A seller using a market order receives the bid, not the midpoint, and in a fast-moving market the bid can be well below the last printed price. The direction of slippage depends on which way prices move between order submission and fill, and market impact works against both buyers and sellers.
Is slippage worse on cryptocurrency markets than on stock markets?
Generally, yes, for a few structural reasons. Crypto markets operate continuously, but liquidity concentrates during certain hours. Many token pairs trade almost exclusively on one or two venues with no consolidated tape. Spreads on smaller tokens can be several percent wide. That said, the most actively traded major tokens on the largest venues can have slippage comparable to a mid-cap stock on a slower trading day.
Can a broker guarantee me against slippage?
No broker can guarantee zero slippage on market orders as a general rule. Some brokers advertise "price improvement," meaning they sometimes fill you at a better price than the national best quote. This is real but applies to specific circumstances and does not eliminate slippage in all conditions. Reading your broker's execution quality disclosures carefully tells you more than any marketing claim.
Does slippage matter less if I am a long-term investor?
It matters less per trade, but the logic changes depending on your behavior. A buy-and-hold investor placing a handful of large orders per year faces far fewer slippage events than an active trader. However, a single large order in an illiquid instrument can still generate meaningful slippage. Position sizing relative to the liquidity of what you are buying remains worth considering regardless of holding period.
Why do some traders use limit orders to control slippage?
A limit order specifies a maximum price you will pay (for a buy) or a minimum price you will accept (for a sell). Because the order only executes at your stated price or better, market impact slippage beyond your limit is impossible by definition. The tradeoff is execution risk: if the market never reaches your price, you do not fill. Traders who use limits are trading slippage risk for opportunity risk.
What to Look at Next
If you want to go deeper on the mechanics behind these ideas, the following topics build on what is covered here:
- Order book mechanics: how bids, asks, and depth of market interact in real time
- Market microstructure: the academic field that studies how prices form and orders get filled
- Transaction cost analysis (TCA): the methods institutions use to measure execution quality after the fact
- Limit vs. market orders: the tradeoffs in more detail, including when each type makes sense structurally
Understanding slippage will not tell you what to buy or sell. But it gives you a more complete picture of what a trade actually costs.
This article is general information, not financial advice. See our disclaimer.